.avif)

Brands cluster where they sell. Audiences cluster where they worry.
We measured 200 conversations across fashion, beauty and travel on UK social search. In category after category, the conversation with the largest audience turned out to be the one brands had posted in least.
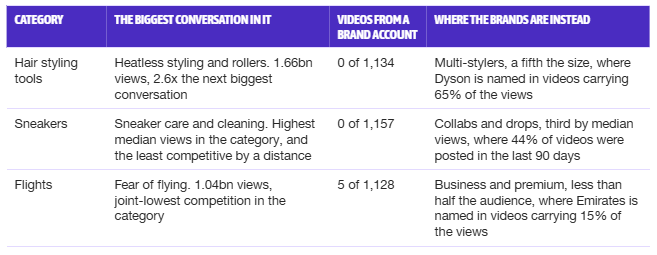
None of this is a failure of effort. Each of those brands is publishing hard. They are publishing into the conversation that matches what they sell, while the audience gathers around the thing it is anxious about: ruining its hair, ruining its trainers, getting on the plane.
What the Index is
The Search Everywhere Index maps the conversations inside an industry and shows you which ones have an audience nobody is serving.
It exists because social platforms became search engines and nobody started measuring them like one. Keyword tools tell you what people type into Google. Social listening tells you what people say about your brand. Neither tells you what people search for on TikTok, or what comes back when they do. That is the gap this fills.
The structure goes industry, topic, conversation. Every topic holds exactly ten conversations, and every conversation is measured through 45 to 50 search terms. We run those terms through TikTok and YouTube search in the UK and keep what the platforms actually return, rather than what a tool estimates they would.
How to read the chart
Each topic is one chart and each circle on it is one of the ten conversations in that topic.
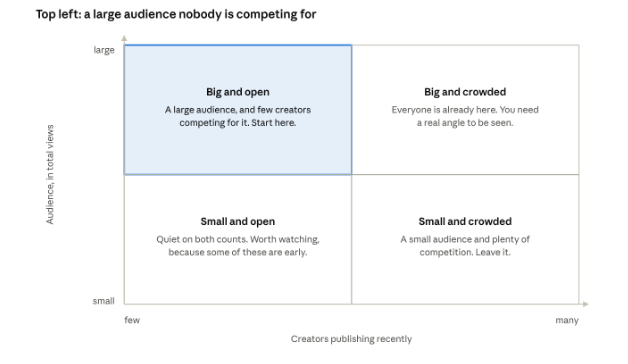
The circle itself carries a third measure: its size is the median views per video. A big circle high on the left is a conversation where the typical video does well, the audience is large, and almost nobody is making anything.
How it is measured
Every number comes from live platform search results, collected in the UK and dated. There is no modelling and no estimation.
Circle size is the median views per video, not the mean. One viral hit cannot inflate a conversation, which matters because a single 60-million-view video would otherwise make a dead conversation look alive.
Competition is the share of a conversation's videos posted recently: the last 90 days on TikTok, the last 12 months on YouTube, because the two platforms surface content over very different spans.
Quadrant lines sit at the median of the ten conversations in that topic. Every position is relative to its own category, never an absolute score. A conversation that looks crowded in beauty might be the quietest room in travel.
One thing we deliberately do not do: filter TikTok results by topic. We built that filter and then threw it away. TikTok captions are conversational and frequently never name the product, so screening for topic words removed about half the legitimate content in our test category, including whole genres like resale and authentication. YouTube titles and descriptions are explicit enough that we do filter there. The index says which treatment each topic got.
We also publish what went wrong. Where search terms returned nothing, or returned content unrelated to the conversation they were assigned to, there is a note on the topic saying how many and how much of the view count they carry.
Go and find your category
Open your industry, open your topic, and look at the top left of the chart. Then ask three questions.
- Is anything big sitting on its own up there? That is an audience with no competition for it. It is the cheapest content you will ever make.
- What is the content half-life? Some conversations keep earning views for years. Sneaker care is still pulling traffic nearly three years after posting, which changes what a single video is worth.
- Who is already in the room? The brand bar shows who gets named. If your category leader is absent from the biggest conversation, so is everyone else, and that will not last.
Fashion, beauty and travel are live now. Finance and tech are next, and Instagram and Pinterest will join TikTok and YouTube. Where a topic has more than one platform, a blended Search Everywhere view scores each conversation against its own platform and averages the two, because a view on TikTok and a view on YouTube are not the same thing and should never be added together.
It is free and there is no signup. If you want us to map your brand specifically, rather than your category, there is a form at the bottom of every topic.
Check it out now - Explore the Search Everywhere Conversation Index
Frequently Asked Questions
Where does the data come from?
Live search results from the respective socials platforms and taken from the relevant markets collected through a commercial scraping API and dated at the point of collection. We run every term, keep what the platform returns, and record the terms that failed (re-running them as appropriate). Nothing is modelled, sampled or estimated.
How is this different from a keyword tool?
Semrush and Ahrefs tell you what people type into Google. This tells you what people search for on social platforms, and what comes back when they do. A keyword tool measures demand. This measures demand and supply in the same picture, which is the bit that tells you whether to bother.
How is this different from Social Listening?
Listening measures mentions: what people say about your brand, unprompted. This measures search: what people go looking for. A conversation can be enormous in search and invisible in listening, because nobody tags a brand when they type "how to clean white trainers".
Aren't social-search results personalised?
Results are collected against a region setting rather than a logged-in account, so they reflect what the platform returns for that query in that market, not somebody's personal feed. That is also why the index is market-specific rather than a global average that would describe nobody.